Understanding the Importance of Crime Data
Crime data offers critical insights into the safety and stability of a neighborhood, directly influencing property values, insurance rates, and the overall quality of life for residents. A comprehensive understanding of these statistics allows potential homeowners to assess personal risk, evaluate the long-term investment potential of a property, and ensure the chosen environment aligns with their safety expectations and lifestyle needs.
Evaluating crime rates extends beyond personal safety; it significantly impacts financial aspects of homeownership. High crime areas often correlate with lower property values and higher insurance premiums, reflecting increased risk for both residents and insurers. Conversely, neighborhoods with consistently low crime rates tend to appreciate more steadily and offer a greater sense of community security.
Moreover, understanding crime patterns can reveal underlying community issues or strengths. For instance, a rise in petty theft might indicate economic distress, while a decrease in violent crime could point to successful community policing initiatives. These insights are invaluable for anyone looking to integrate into a new community, providing a clearer picture of its social fabric and potential challenges.
Accessing Public Crime Databases
Public crime databases serve as primary resources for obtaining detailed and often granular information about criminal activity within specific geographic areas, providing transparency into local safety conditions. These platforms, typically maintained by federal, state, or local law enforcement agencies, compile incident reports, arrest records, and statistical summaries that are crucial for prospective homebuyers to evaluate neighborhood safety comprehensively.
The Federal Bureau of Investigation (FBI) maintains the Uniform Crime Reporting (UCR) Program, which collects data from thousands of law enforcement agencies across the United States. While the UCR provides broad national and regional trends, local police department websites often offer more specific, up-to-date data for individual neighborhoods. Many departments now feature interactive crime maps that pinpoint incident locations and types.
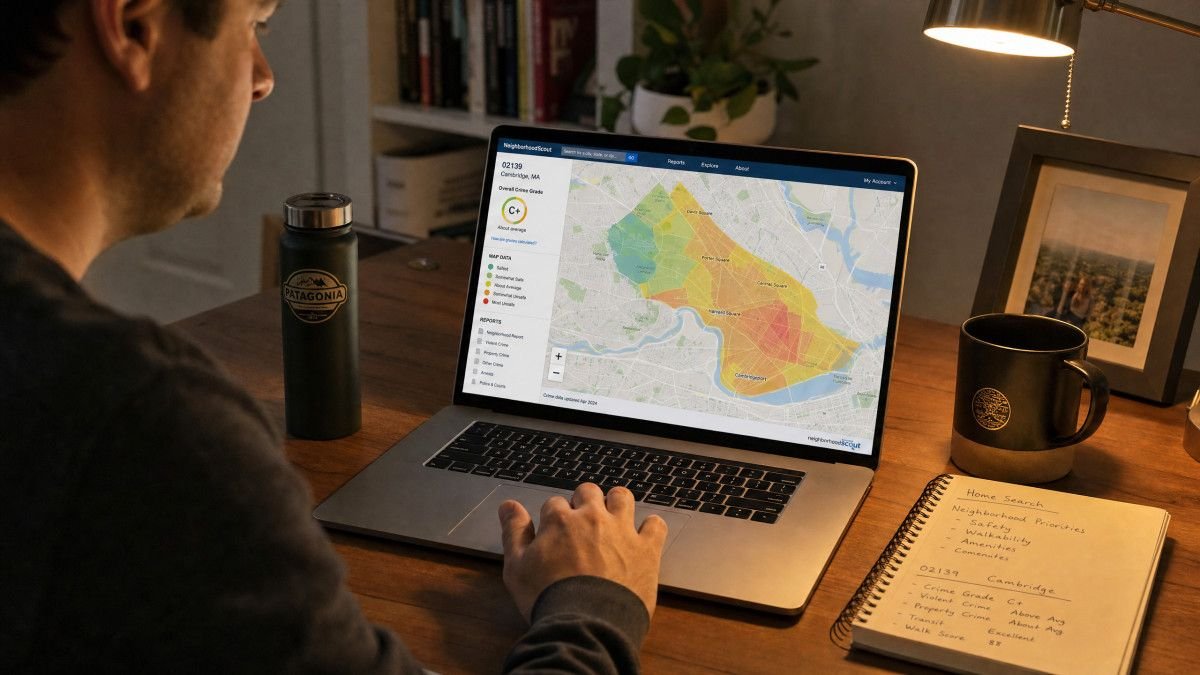
Beyond official government sources, several non-profit organizations and commercial services aggregate and analyze crime data. Websites like NeighborhoodScout and CrimeReports.com synthesize information from various sources, presenting it in an easily digestible format, often with neighborhood-specific safety scores and historical trends. These tools can be particularly useful for comparing multiple areas quickly.
Analyzing Police Reports and Local Data
Directly analyzing police reports and local law enforcement data provides a granular view of specific crime types, frequencies, and response times, offering a more nuanced understanding than aggregated statistics alone. This detailed examination allows potential residents to identify prevalent issues, assess the effectiveness of local policing, and determine if particular safety concerns align with their personal risk tolerance.
When reviewing police reports, pay close attention to the nature of crimes (e.g., burglaries, assaults, vandalism), their frequency, and the time of day they typically occur. This can help identify specific vulnerabilities or patterns. For example, a high number of daytime property crimes might suggest a need for robust home security systems, while frequent late-night incidents could indicate issues with street lighting or patrol presence.
Local data often includes information on arrests, convictions, and community outreach programs, which can reflect the proactive efforts of law enforcement. According to a 2023 report by the Bureau of Justice Statistics, only 45% of violent crimes and 17% of property crimes were reported to the police nationwide [1]. This statistic underscores the importance of looking beyond reported incidents to understand the full scope of criminal activity, possibly through community forums or local news archives.
Utilizing Crime Mapping Tools
Crime mapping tools visually represent criminal activity on a geographical interface, enabling users to quickly identify high-incident areas, visualize crime density, and understand spatial patterns that might not be apparent from raw data tables. These interactive maps empower prospective homebuyers to make informed decisions by providing an intuitive and accessible overview of neighborhood safety dynamics.
These tools typically allow users to filter crime data by type, date range, and severity, offering a customizable view of an area’s safety profile. For instance, one can often distinguish between property crimes, violent crimes, and quality-of-life offenses. This granularity helps in understanding the specific risks associated with a particular block or street, rather than relying on broad neighborhood averages.
Many crime mapping platforms also integrate with other demographic and socioeconomic data, providing a richer context for crime patterns. For example, correlating crime hotspots with areas of high unemployment or low educational attainment can offer insights into root causes. Dr. Emily Turner, a criminologist at the National Institute of Justice, states, “Crime mapping tools are invaluable for visualizing complex data and making it accessible to the public, fostering greater community awareness and engagement in safety initiatives.” This expert perspective highlights the dual benefit of these tools: informing individuals and empowering communities.
Factors to Consider Beyond Raw Statistics
While crime statistics provide a quantitative measure of neighborhood safety, a holistic assessment requires considering qualitative factors such as community engagement, local infrastructure, and the presence of neighborhood watch programs. These elements contribute significantly to the perceived and actual safety of an area, offering a more complete picture than numbers alone can convey.
The presence of active neighborhood watch programs, well-maintained public spaces, and good street lighting can deter criminal activity and foster a sense of security. A community where residents actively participate in local events and look out for one another often experiences lower crime rates, regardless of statistical fluctuations. These social indicators are crucial for understanding the true resilience and safety of a neighborhood.
Furthermore, local amenities and infrastructure play a role. Access to quality schools, parks, and community centers can indicate a thriving area with engaged residents, which often correlates with lower crime. Conversely, neglected public spaces or a lack of community resources can sometimes be indicators of areas more prone to certain types of crime. Observing these details during visits can provide invaluable insights.
Comparing Neighborhood Safety Metrics
Effectively comparing neighborhood safety metrics involves evaluating various data points, including crime rates, types of incidents, and community initiatives, to form a comprehensive understanding of relative security. This comparative analysis helps prospective homebuyers weigh the pros and cons of different areas, ensuring their chosen location aligns with their safety preferences and lifestyle requirements.
| Metric | Low Crime Neighborhood | Moderate Crime Neighborhood | High Crime Neighborhood |
|---|---|---|---|
| Violent Crime Rate (per 1,000 residents) | < 1.0 | 1.0 – 5.0 | > 5.0 |
| Property Crime Rate (per 1,000 residents) | < 10.0 | 10.0 – 30.0 | > 30.0 |
| Police Response Time | Under 5 minutes | 5-15 minutes | Over 15 minutes |
| Neighborhood Watch Program | Active and well-organized | Present, but less active | Rare or non-existent |
| Street Lighting Quality | Excellent, well-lit everywhere | Adequate in main areas | Poor, many dark spots |
When comparing neighborhoods, it is essential to look beyond just the overall crime rate. Two areas might have similar total crime numbers, but one could have a higher incidence of violent crime while the other experiences more property offenses. Understanding these distinctions is crucial for aligning a neighborhood’s safety profile with individual priorities.
Consider the trends over time as well. A neighborhood with a slightly higher current crime rate but a consistent downward trend might be a better long-term investment than one with a lower current rate but an upward trajectory. Consulting local real estate agents and community leaders can also provide valuable qualitative insights that complement statistical data.
Conducting On-the-Ground Research
On-the-ground research, involving physical visits at various times and direct engagement with residents, offers invaluable qualitative data that complements statistical analysis, providing a firsthand understanding of a neighborhood’s atmosphere and safety. This direct observation allows prospective homebuyers to gauge the true living experience and identify subtle indicators of community well-being that are not captured in official reports.
Visiting a potential neighborhood during different times of the day and week can reveal varied aspects of its character. A street that feels vibrant and safe during the day might feel deserted or less secure at night. Observe pedestrian traffic, the presence of children playing, and how well properties are maintained. These visual cues can speak volumes about community pride and safety.
Engaging with current residents, local business owners, and community leaders can provide anecdotal evidence and personal perspectives on safety that statistics cannot. Ask about their experiences, any concerns they might have, and what they appreciate about the neighborhood. Their insights can offer a realistic portrayal of daily life and help confirm or challenge assumptions derived from data.
Frequently Asked Questions
What are the most reliable sources for neighborhood crime data?
Reliable sources include the FBI’s Uniform Crime Reporting (UCR) Program, local police department websites, and reputable crime mapping services like NeighborhoodScout or CrimeReports. These platforms often provide detailed statistics and incident maps for specific areas.
How can I interpret crime statistics effectively?
When interpreting crime statistics, consider the types of crimes reported (violent vs. property), the population density of the area, and trends over time. A high number of minor incidents might be less concerning than a few serious violent crimes. Always compare data to similar neighborhoods or regional averages.
Are there any free tools available to check crime rates?
Yes, many local police departments offer free online crime maps and data. Websites like the National Sex Offender Public Website and various state-level judicial portals also provide public records. Some commercial sites offer basic crime data for free before requiring a subscription for more detailed reports.
Beyond statistics, what other factors indicate neighborhood safety?
Beyond raw statistics, consider factors like street lighting, neighborhood watch programs, the presence of active community organizations, and general upkeep of properties. Visiting the neighborhood at different times of day and night can also provide valuable qualitative insights into its safety and atmosphere.
Thoroughly researching crime rates is an indispensable part of the home-buying process, offering peace of mind and safeguarding a significant investment. By combining official statistics with qualitative observations and expert insights, prospective homeowners can gain a nuanced understanding of a neighborhood’s safety profile. This diligent approach ensures that the chosen community not only meets aesthetic and financial criteria but also provides a secure and comfortable living environment for years to come.
References
- Bureau of Justice Statistics. (2023). *Criminal Victimization, 2022*. U.S. Department of Justice.